Home
| About
| Mine Tracker
| RSS
| Footer
▄▄▄▄▄▄▄▄▄▄▄▄▄▄▄▄▄▄▄▄▄▄▄▄▄▄▄▄▄▄▄▄▄▄▄▄▄▄▄▄▄▄▄▄▄▄▄▄▄▄▄▄▄▄▄▄▄▄▄▄▄▄▄▄▄▄▄▄▄▄▄▄▄▄▄▄▄▄▄▄▄▄▄▄▄▄▄▄▄▄▄▄▄▄▄▄
█▄▄░▄▄█░▄▄▀█░▄▄▀█▀▄▀█░▄▄███░▄▄▀█░▄▄▀█░▄▀███▄▄░▄▄█░▄▄▀█░▄▄▀█▀▄▀█░▄▄█░▄▄▀█░▄▄▀██▄██░███▄██▄░▄█░██░
███░███░▀▀▄█░▀▀░█░█▀█░▄▄███░▀▀░█░██░█░█░█████░███░▀▀▄█░▀▀░█░█▀█░▄▄█░▀▀░█░▄▄▀██░▄█░███░▄██░██░▀▀░
███░███▄█▄▄█▄██▄██▄██▄▄▄███▄██▄█▄██▄█▄▄██████░███▄█▄▄█▄██▄██▄██▄▄▄█▄██▄█▄▄▄▄█▄▄▄█▄▄█▄▄▄██▄██▀▀▀▄
▀▀▀▀▀▀▀▀▀▀▀▀▀▀▀▀▀▀▀▀▀▀▀▀▀▀▀▀▀▀▀▀▀▀▀▀▀▀▀▀▀▀▀▀▀▀▀▀▀▀▀▀▀▀▀▀▀▀▀▀▀▀▀▀▀▀▀▀▀▀▀▀▀▀▀▀▀▀▀▀▀▀▀▀▀▀▀▀▀▀▀▀▀▀▀▀
Article; Measuring Global Value Chains
https://www.annualreviews.org/doi/pdf/10.1146/annurev-economics-080217-053600
Recent decades have seen the emergence of global value chains (GVCs), in which production stages for individual goods are broken apart and scattered across countries. Stimulated by these developments, there has been rapid progress in data and methods for measuring GVC linkages. The macro ap- proach to measuring GVCs connects national input–output tables across borders by using bilateral trade data to construct global input–output tables. These tables have been applied to measure trade in value added, the length of and location of producers in GVCs, and price linkages across countries. The micro approach uses firm-level data to document firms’ input sourcing decisions, how import and export participation are linked, and how multi- national firms organize their production networks. In this review, I evaluate progress in these two approaches, highlighting points of contact between them and areas that demand further work. I argue that further convergence between these approaches can strengthen both, yielding a more complete empirical portrait of GVCs.
Paper; Mapping the realignment of global value chains
https://www.bis.org/publ/bisbull78.htm

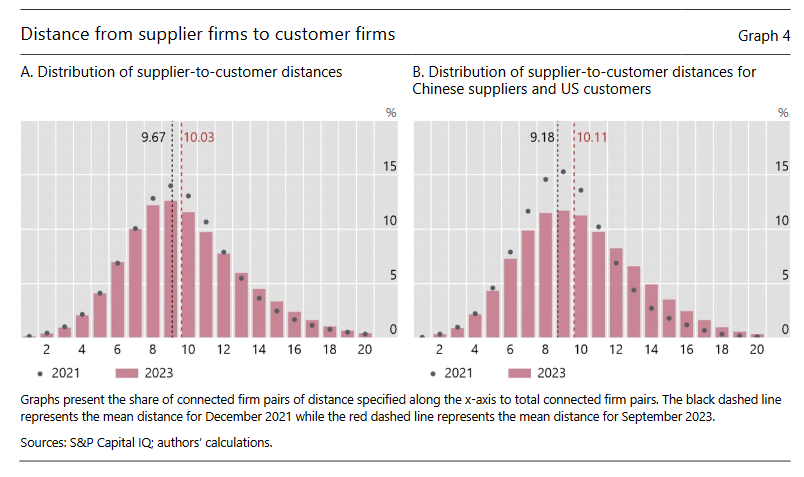
The latest firm-level network data reveal that global value chains have lengthened, although without the accompanying network densification that might indicate that supplier relationships are diversifying. Lengthening of supply chains is especially significant for supplier-customer linkages from China to the United States, where firms from other jurisdictions, notably in Asia, have interposed themselves in the supply chain. Nevertheless, these recent developments have not so far reversed the long-running trend toward greater regional integration of trade in recent decades, especially in Asia.
https://www.bis.org/publ/bisbull78.htm

Trase Supply Chains
https://supplychains.trase.earth/

Trase is at the forefront of a data-driven revolution in supply chain sustainability, drawing on vast sets of production, trade and customs data, for the first time laying bare the flows of globally traded commodities at scales that are directly relevant to decision-making. Its pioneering approach to data analysis and visualization provides full coverage of the export routes and buyers responsible for all production and trade, and the associated sustainability risks, of a given commodity.
The supply chain mapping at the core of Trase balances scale and data resolution. It builds on an enhanced form of material flow analysis called Spatially Explicit Information on Production to Consumption Systems (SEI-PCS) originally developed by Godar et al. 2015. Three capabilities of the Trase approach together set it apart from other approaches to supply chain mapping:
https://supplychains.trase.earth/

Trase is at the forefront of a data-driven revolution in supply chain sustainability, drawing on vast sets of production, trade and customs data, for the first time laying bare the flows of globally traded commodities at scales that are directly relevant to decision-making. Its pioneering approach to data analysis and visualization provides full coverage of the export routes and buyers responsible for all production and trade, and the associated sustainability risks, of a given commodity.
The supply chain mapping at the core of Trase balances scale and data resolution. It builds on an enhanced form of material flow analysis called Spatially Explicit Information on Production to Consumption Systems (SEI-PCS) originally developed by Godar et al. 2015. Three capabilities of the Trase approach together set it apart from other approaches to supply chain mapping:
It systematically links individual supply chain actors to specific, subnational production regions, and the sustainability risks and investment opportunities associated with those regions;
It identifies the individual companies that export, ship and import a given traded commodity; and
It covers all of the exports of a given commodity from a given country of production.
Paper; Global mining footprint mapped from high-resolution satellite imagery
https://www.nature.com/articles/s43247-023-00805-6

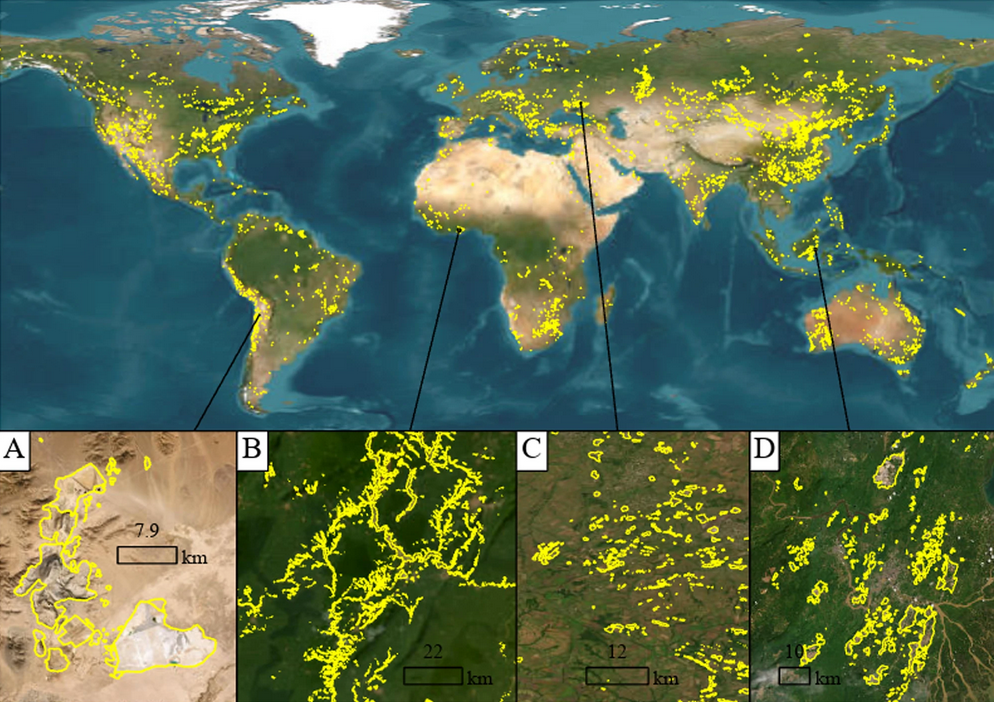
Mining is of major economic, environmental and societal consequence, yet knowledge and understanding of its global footprint is still limited. Here, we produce a global mining land use dataset via remote sensing analysis of high-resolution, publicly available satellite imagery. The dataset comprises 74,548 polygons, covering ~66,000?km2 of features like waste rock dumps, pits, water ponds, tailings dams, heap leach pads and processing/milling infrastructure.
https://www.nature.com/articles/s43247-023-00805-6

Mining is of major economic, environmental and societal consequence, yet knowledge and understanding of its global footprint is still limited. Here, we produce a global mining land use dataset via remote sensing analysis of high-resolution, publicly available satellite imagery. The dataset comprises 74,548 polygons, covering ~66,000?km2 of features like waste rock dumps, pits, water ponds, tailings dams, heap leach pads and processing/milling infrastructure.
Climate Trace
https://climatetrace.org/map

We harness satellite imagery and other forms of remote sensing, artificial intelligence, and collective data science expertise to track human-caused GHG emissions with unprecedented detail and speed. Climate TRACE’s emissions inventory is the world’s first comprehensive accounting of GHG emissions based primarily on direct, independent observation. Our innovative, open, and accessible approach relies on advances in technology to fill critical knowledge gaps for all decision makers that rely on the patchwork system of self-reporting that serves as the basis for most existing emissions inventories.
https://climatetrace.org/map

We harness satellite imagery and other forms of remote sensing, artificial intelligence, and collective data science expertise to track human-caused GHG emissions with unprecedented detail and speed. Climate TRACE’s emissions inventory is the world’s first comprehensive accounting of GHG emissions based primarily on direct, independent observation. Our innovative, open, and accessible approach relies on advances in technology to fill critical knowledge gaps for all decision makers that rely on the patchwork system of self-reporting that serves as the basis for most existing emissions inventories.
SCM Globe. Company website
https://www.scmglobe.com/
SCM Globe provides supply chain modeling and simulation software that is engaging, easy to use, and accurate. Our map-based simulations teach principles of pragmatic supply chain management to students around the world. People also use our simulations to analyze and improve real supply chains, or design new ones.
Copper Alliance - copper pathways
https://copperalliance.org/sustainable-copper/copper-pathways-map/
A global view of copper production and trade
https://copperalliance.org/sustainable-copper/copper-pathways-map/
A global view of copper production and trade
Open Apparel Registry (OAR)
https://openapparel.org/
The Open Apparel Registry (OAR) is a free, open data tool mapping garment facilities worldwide and allocating a unique ID to each.
https://openapparel.org/
The Open Apparel Registry (OAR) is a free, open data tool mapping garment facilities worldwide and allocating a unique ID to each.
Nike Manufacturing Map
https://manufacturingmap.nikeinc.com

Virtually all NIKE, Inc. materials and finished products are sourced from, or manufactured by, independent suppliers that also make or provide products for other global companies. That means that NIKE does not own, operate or employ workers at these locations. NIKE also has license agreements that permit unaffiliated parties to manufacture and sell products using NIKE-owned trademarks. The suppliers featured on this map are those used by NIKE, Inc., licensees or agents to manufacture finished goods, as well as materials suppliers.
https://manufacturingmap.nikeinc.com

Virtually all NIKE, Inc. materials and finished products are sourced from, or manufactured by, independent suppliers that also make or provide products for other global companies. That means that NIKE does not own, operate or employ workers at these locations. NIKE also has license agreements that permit unaffiliated parties to manufacture and sell products using NIKE-owned trademarks. The suppliers featured on this map are those used by NIKE, Inc., licensees or agents to manufacture finished goods, as well as materials suppliers.
Trusted data for tankers
https://www.balticexchange.com/en/data-services/routes.html

The Baltic Exchange provides a complete picture of the tanker market through its daily physical and forward assessments, weekly Sale & Purchase and vessel recycling data, and quarterly benchmark of operating costs.
https://www.balticexchange.com/en/data-services/routes.html

The Baltic Exchange provides a complete picture of the tanker market through its daily physical and forward assessments, weekly Sale & Purchase and vessel recycling data, and quarterly benchmark of operating costs.
How MIT Visualizes Supply Chain Risk
https://sourcemap.com/news/2015/9/15/how-mit-visualizes-supply-chain-risk
Bruce Arntzen of the MIT Center for Transportation and Logistics describes how he uses Sourcemap to create automatic visualizations of complex supply chains to help manufacturers avoid and plan for risk in the end-to-end supply chain. Video, 2015.
MANIFEST: Supply Chain Platform
https://manifest.supplystudies.com/
This is the digital (and physical) supply chain for Manifest itself. Manifest is, according to the about page: "an investigative toolkit intended for researchers, journalists, students, and scholars interested in visualizing, analyzing, and documenting supply chains, production lines, and trade networks."
Consumer traceability for tilapia
https://www.jumbo.com/inspiratie/vis/tilapia

In 2019 Dutch retailer Jumbo offered customers the possibility to trace 3 tilapia product back the farm in Indonesia.
https://www.jumbo.com/inspiratie/vis/tilapia

In 2019 Dutch retailer Jumbo offered customers the possibility to trace 3 tilapia product back the farm in Indonesia.