Home
| About
| Mine Tracker
| RSS
| Footer
▄▄▄▄▄▄▄▄▄▄▄▄▄▄▄▄▄▄▄▄▄▄▄▄▄▄▄▄▄▄▄▄▄▄▄▄▄▄▄▄▄▄▄▄▄▄▄▄▄▄▄▄▄▄▄▄▄▄▄▄▄▄▄▄▄▄▄▄▄▄▄▄▄▄▄▄▄▄▄▄▄▄▄▄▄▄▄▄▄▄▄▄▄▄▄▄
█▄▄░▄▄█░▄▄▀█░▄▄▀█▀▄▀█░▄▄███░▄▄▀█░▄▄▀█░▄▀███▄▄░▄▄█░▄▄▀█░▄▄▀█▀▄▀█░▄▄█░▄▄▀█░▄▄▀██▄██░███▄██▄░▄█░██░
███░███░▀▀▄█░▀▀░█░█▀█░▄▄███░▀▀░█░██░█░█░█████░███░▀▀▄█░▀▀░█░█▀█░▄▄█░▀▀░█░▄▄▀██░▄█░███░▄██░██░▀▀░
███░███▄█▄▄█▄██▄██▄██▄▄▄███▄██▄█▄██▄█▄▄██████░███▄█▄▄█▄██▄██▄██▄▄▄█▄██▄█▄▄▄▄█▄▄▄█▄▄█▄▄▄██▄██▀▀▀▄
▀▀▀▀▀▀▀▀▀▀▀▀▀▀▀▀▀▀▀▀▀▀▀▀▀▀▀▀▀▀▀▀▀▀▀▀▀▀▀▀▀▀▀▀▀▀▀▀▀▀▀▀▀▀▀▀▀▀▀▀▀▀▀▀▀▀▀▀▀▀▀▀▀▀▀▀▀▀▀▀▀▀▀▀▀▀▀▀▀▀▀▀▀▀▀▀
Paper; Global mining footprint mapped from high-resolution satellite imagery
https://www.nature.com/articles/s43247-023-00805-6
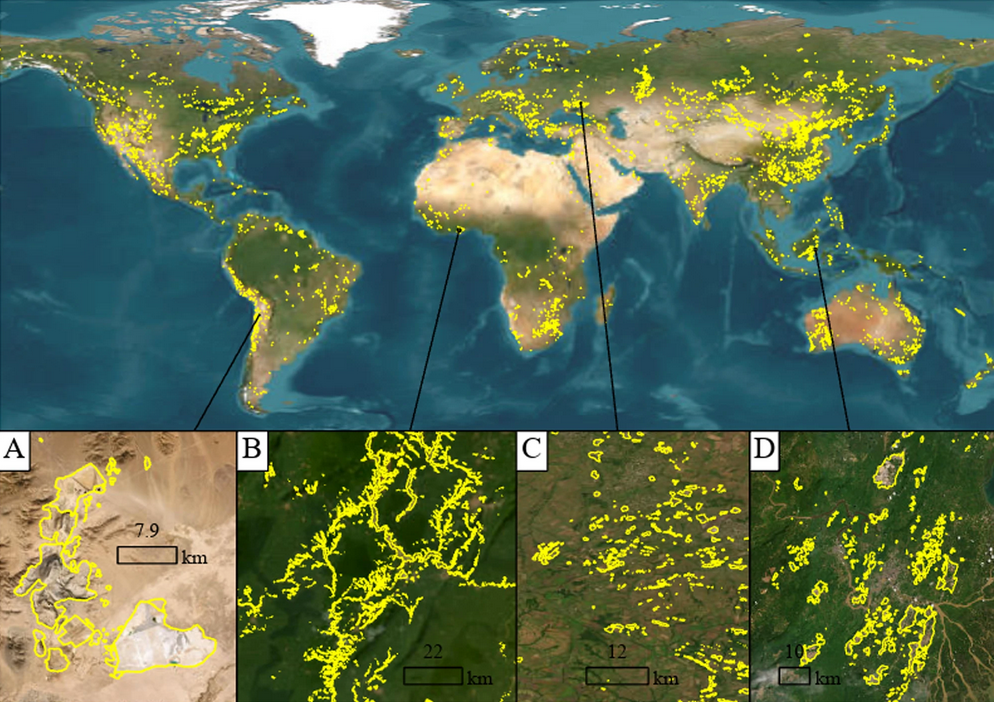
Mining is of major economic, environmental and societal consequence, yet knowledge and understanding of its global footprint is still limited. Here, we produce a global mining land use dataset via remote sensing analysis of high-resolution, publicly available satellite imagery. The dataset comprises 74,548 polygons, covering ~66,000?km2 of features like waste rock dumps, pits, water ponds, tailings dams, heap leach pads and processing/milling infrastructure.
https://www.nature.com/articles/s43247-023-00805-6
Mining is of major economic, environmental and societal consequence, yet knowledge and understanding of its global footprint is still limited. Here, we produce a global mining land use dataset via remote sensing analysis of high-resolution, publicly available satellite imagery. The dataset comprises 74,548 polygons, covering ~66,000?km2 of features like waste rock dumps, pits, water ponds, tailings dams, heap leach pads and processing/milling infrastructure.
Article, A global-scale data set of mining areas
https://www.nature.com/articles/s41597-020-00624-w

The area used for mineral extraction is a key indicator for understanding and mitigating the environmental impacts caused by the extractive sector. To date, worldwide data products on mineral extraction do not report the area used by mining activities. In this paper, we contribute to filling this gap by presenting a new data set of mining extents derived by visual interpretation of satellite images. We delineated mining areas within a 10?km buffer from the approximate geographical coordinates of more than six thousand active mining sites across the globe. The result is a global-scale data set consisting of 21,060 polygons that add up to 57,277?km2. The polygons cover all mining above-ground features that could be identified from the satellite images, including open cuts, tailings dams, waste rock dumps, water ponds, and processing infrastructure.
https://www.nature.com/articles/s41597-020-00624-w
The area used for mineral extraction is a key indicator for understanding and mitigating the environmental impacts caused by the extractive sector. To date, worldwide data products on mineral extraction do not report the area used by mining activities. In this paper, we contribute to filling this gap by presenting a new data set of mining extents derived by visual interpretation of satellite images. We delineated mining areas within a 10?km buffer from the approximate geographical coordinates of more than six thousand active mining sites across the globe. The result is a global-scale data set consisting of 21,060 polygons that add up to 57,277?km2. The polygons cover all mining above-ground features that could be identified from the satellite images, including open cuts, tailings dams, waste rock dumps, water ponds, and processing infrastructure.
Austalian Mines Dataset
https://catalogue.data.wa.gov.au/dataset/operating-mines/resource/f5453f34-2f4d-40b8-8b66-365b39351eec?inner_span=True
MINEDEX provides a coordinated, project-based enquiry system for textual information on mine, deposits, prospects, etc., and related infrastructure. The Operating Mine Map custom data extract is a regularly-updated point representation of the State's mines that have a Status of either operating or under development that appear on an annually produced map. The mines are automatically selected by Status and updated regularly.
Why tracing seafood from sea to plate is the next frontier in sustainability
https://www.worldwildlife.org/stories/why-tracing-seafood-from-sea-to-plate-is-the-next-frontier-in-sustainability
Traceability starts with attaching to each fish caught a set of information such as where and when the fish was caught, the name of the fishing boat, the license it carries, and the type of gear the fishers used. Detailed data are essential because tracing seafood from sea to plate is not a simple proposition. Global supply chains in this massive industry are complex; some fish might pass through a dozen different companies and several countries before reaching a dinner plate. Ensuring that traded fish have a detailed and connected data trail to their origin is the best way to inform assessments of a fishery’s impact on the environment and its labor practices. But there is no way to trace products through such complex journeys without a uniform standard for digital data collection and sharing. That’s why WWF spent years working with dozens of companies around the world to create the Global Dialogue on Seafood Traceability standards.
Report: Untangling Apparel Supply Chains with Open Data
https://cdn2.assets-servd.host/tidy-shrike/production/assets/downloads/From-Opaque-to-Open.pdf
Those working in the apparel industry know how complex and fragmented apparel supply chains are, with even the simplest of items involving multiple suppliers across multiple continents. Following the mass uptake of off- shoring in the 80s and 90s, the supply chains of most global brands are thousands of miles away from their headquarters or the final point of sale, and the majority of brands don’t own the facilities in which their products are being made. This physical distance and lack of ownership makes keeping track of supply chains a complex and costly endeavor.